GitHub is a popular cloud-based platform used by software engineers and data scientists use to document projects and collaborate effectively. As a free repository, GitHub can also help you document your work for this course. For example, rather than submitting datasets directly to me, you’ll learn how to read data from cloud repositories like GitHub and Dropbox.
I expect to see the following structure in your GitHub repository: - A repository named LU_BAP_CIR - A folder named datasets within the repository - The Acemoglu_Robinson_2001 dataset.csv uploaded inside the Datasets folder
9.2Question 2: Attitude toward violent methods of resiatnce
In a paper published in Research & Politics, my co-author and I explore the effects of providing information on individuals’ support for nonviolent resistance through an experimental survey. You can access the draft of the paper here.
For this assignment, we will use a modified version of the dataset collected for this study. The dataset is publicly available on my GitHub page and can be accessed here.
9.2.1 Dataset Description
Before assigning participants in the experiment to control and treatment groups, we collected data on several socio-economic factors and participants’ pre-experiment attitudes toward both nonviolent and violent methods of resistance.
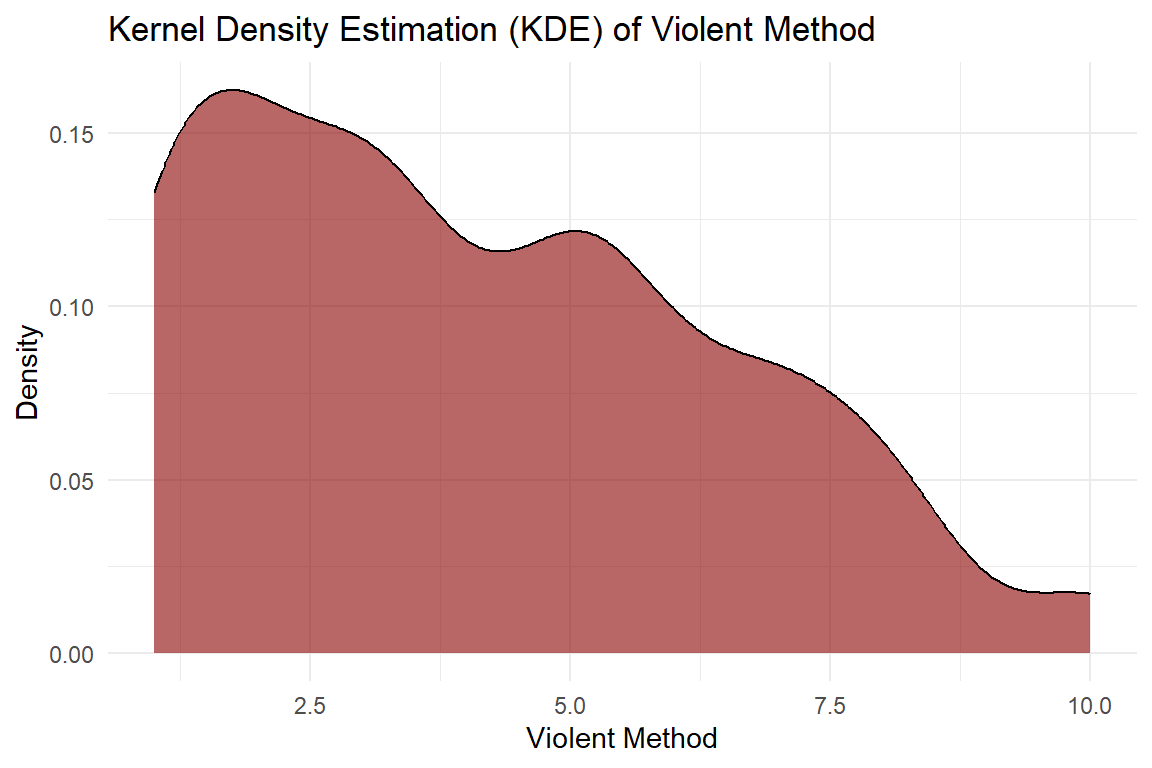
For this assignment, we will focus on analyzing the variable Violent_method, which measures participants’ attitudes toward violent methods of resistance. Let’s begin by loading the dataset and performing some descriptive analysis.
# Load necessary librarieslibrary(ggplot2)# Load the datasetdata_cl <-read.csv("https://raw.githubusercontent.com/babakrezaee/MethodsCourses/master/LeidenUniv_MAQM2020/Datasets/R%26P_RezaeeAsadzadeh_MethodsCourse.csv")# Basic Descriptive Statisticsnrow(data_cl) # Number of observations
[1] 436
summary(data_cl$Violent_method) # Summary statistics for Violent_method
   Min. 1st Qu.  Median    Mean 3rd Qu.    Max.    NA's
  1.000   2.000   3.900   4.081   5.850  10.000       1
# Kernel Density Plot for 'Violent_method'ggplot(data_cl, aes(x = Violent_method)) +geom_density(kernel ="gaussian", fill ="darkred", alpha =0.6, adjust =1) +labs(title ="Kernel Density Estimation (KDE) of Violent Method",x ="Violent Method",y ="Density" ) +theme_minimal()
9.2.2 Assignment: Predicting Attitudes Using k-NN
Model Development:
Use at least three features from the dataset to build your predictive model. Ensure your k-NN algorithm is cross-validated to assess its performance effectively.
Documentation:
Clearly explain the decisions you made throughout the process, including your choice of features, parameter settings (e.g., the value of k), and data preprocessing steps.
Analysis: Discuss your findings in detail. Reflect on the performance of your model, the influence of different features on predictions, and any challenges you encountered during the analysis.
9.3Question 3: Training a Naive Bayes Algorithm
For this assignment, you will use the annotated data from the article by Antypas, Preece , and Camacho-Collados, pubished in Online Social Networks and Media journal: Link to the article. The replication materials of this study is available via its GitHub repository: Here.
Use the method that you learned in class to train a Naive Bayes algorithm that can classify the data to positive sentiment and others. The original data annotated the Tweets to Positive, Negative, Neutral, and Indeterminate. For the sake of simplicity, transform/re-code the annotated tweets to positive if +1 and others if other values, such as 0, -1. We do this for the sake of simolicity, and we get back to this later in the class. You can access the raw data via the below link: https://raw.githubusercontent.com/cardiffnlp/politics-and-virality-twitter/refs/heads/main/data/annotation/en/en_900.csv.
Make sure that your trained Naive Bayes is cross-validated and also report the confusion matrix and (mis)classification rate. Conclude your answer with a brief discussion of the results and the performance of the model.